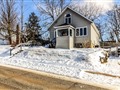
443 Midland Ave
$561,357
Comparative Market Analysis
Jul 4, 2025
NOT AN ACTIVE LISTING
Historical Performance
| Period | $ Change | % Change |
| 1 Day | +$206 | +0.037% |
| 7 Days | +$488 | +0.087% |
| 30 Days | +$499 | +0.089% |
| 3 Months | +$2,905 | +0.520% |
| 6 Months | +$19.4k | +3.58% |
| 1 Year | +$3,680 | +0.660% |
| 3 Years | +$152k | +37.1% |
| 5 Years | +$205k | +57.5% |
| 10 Years | +$326k | +139% |
List My Property
Real Estate Statistics
Financing Solutions
AS SEEN ON


Are You a Licensed Real Estate Agent or Broker?