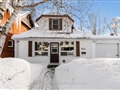
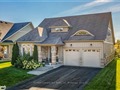
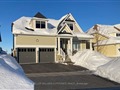
313 Glenbrook Dr
$516,311
Comparative Market Analysis
Jul 4, 2025
NOT AN ACTIVE LISTING
Historical Performance
| Period | $ Change | % Change |
| 1 Day | +$189 | +0.037% |
| 7 Days | +$195 | +0.038% |
| 30 Days | -$835 | -0.162% |
| 3 Months | -$1,987 | -0.383% |
| 6 Months | +$6,838 | +1.34% |
| 1 Year | -$26.8k | -4.93% |
| 3 Years | +$79.6k | +18.2% |
| 5 Years | +$136k | +35.9% |
| 10 Years | +$265k | +106% |
List My Property
Real Estate Statistics
Financing Solutions
Browsing History
278 Galloway Blvd, Midland
2 seconds ago
361 Glenbrook Dr, Midland
3 seconds ago
394 Midland Ave, Midland
4 seconds ago
AS SEEN ON


Are You a Licensed Real Estate Agent or Broker?