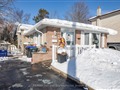
295 Galloway Blvd
$577,207
Comparative Market Analysis
Jul 4, 2025
NOT AN ACTIVE LISTING
Historical Performance
| Period | $ Change | % Change |
| 1 Day | +$211 | +0.037% |
| 7 Days | +$308 | +0.053% |
| 30 Days | -$485 | -0.084% |
| 3 Months | -$654 | -0.113% |
| 6 Months | +$11.2k | +1.98% |
| 1 Year | -$20.4k | -3.41% |
| 3 Years | +$117k | +25.3% |
| 5 Years | +$177k | +44.1% |
| 10 Years | +$313k | +118% |
List My Property
Real Estate Statistics
Financing Solutions
AS SEEN ON


Are You a Licensed Real Estate Agent or Broker?